VDOM 使用
2025/10/29大约 4 分钟
VDOM 使用
网络需求
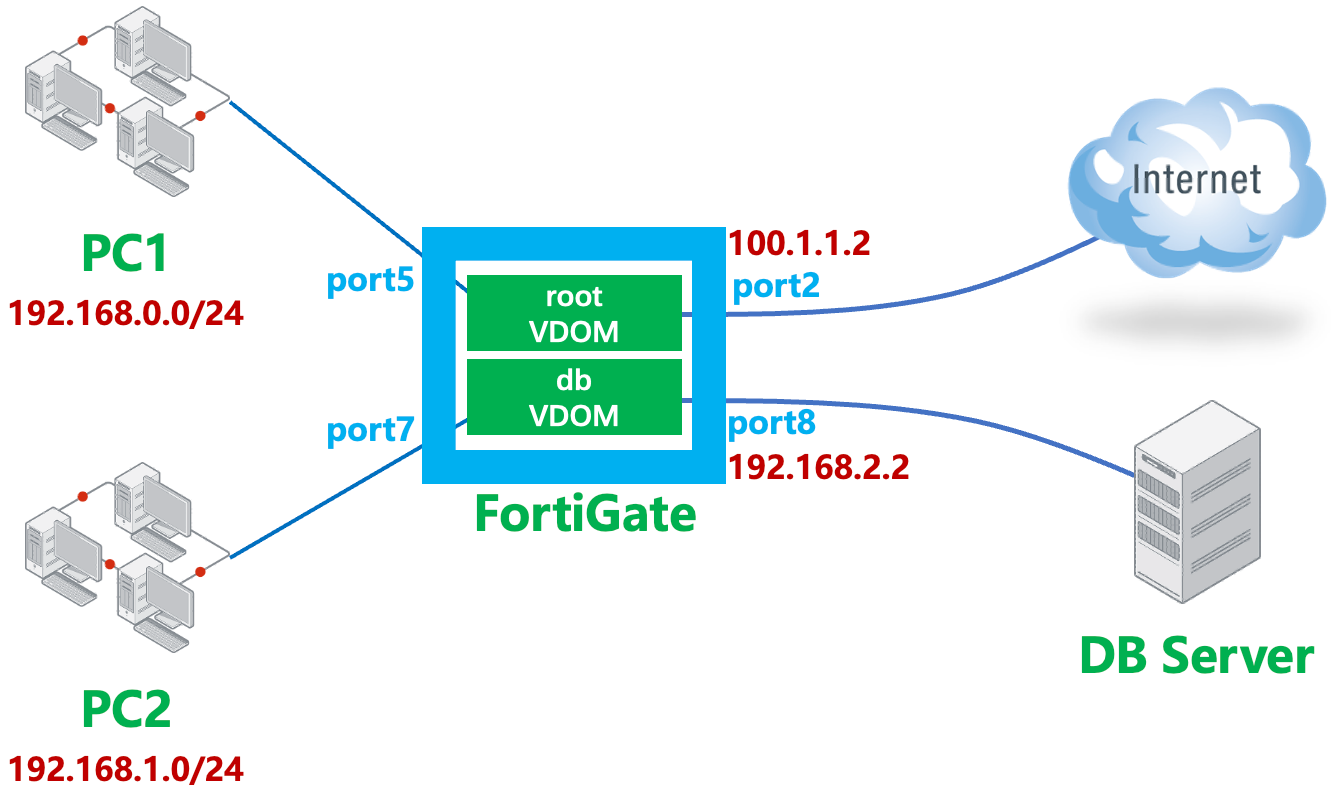
客户上网的业务和内部数据的业务分离。将 FortiGate 划分两个不同的 vdom,一个 root vdom 用于上网,一个 db vdom 用于内网数据库访问。
##网络拓扑
配置步骤
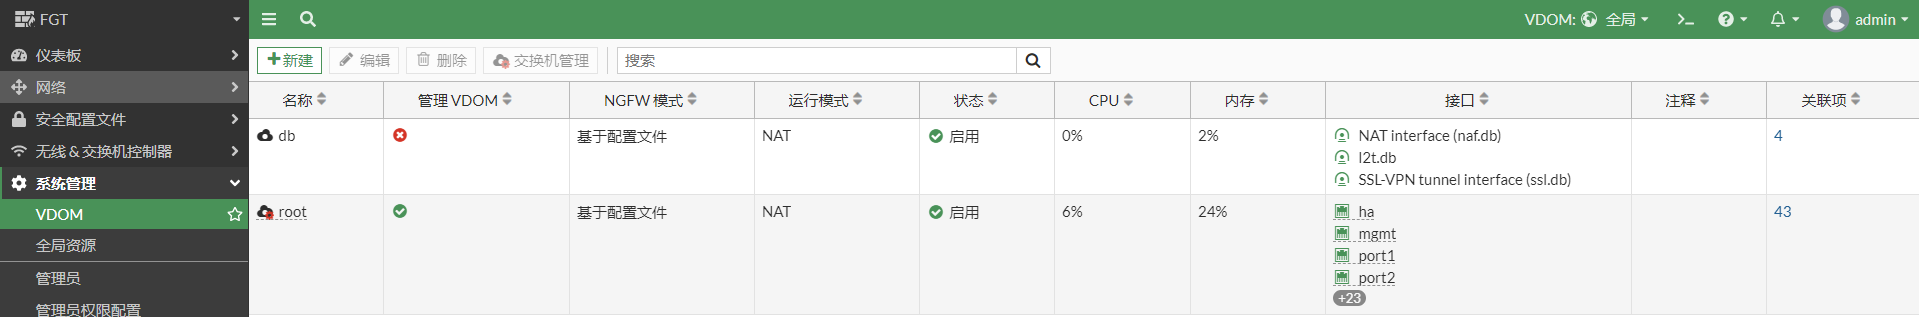
1.创建 vdom
开启 VDOM
config system global
    set vdom-mode multi-vdom
end
创建 VDOM
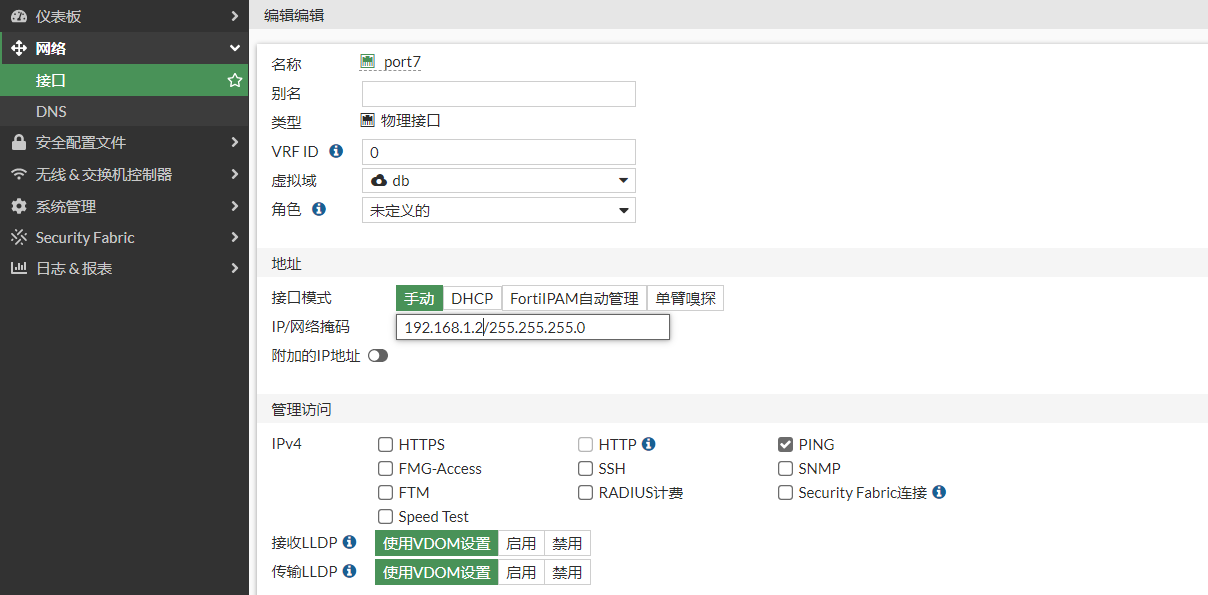
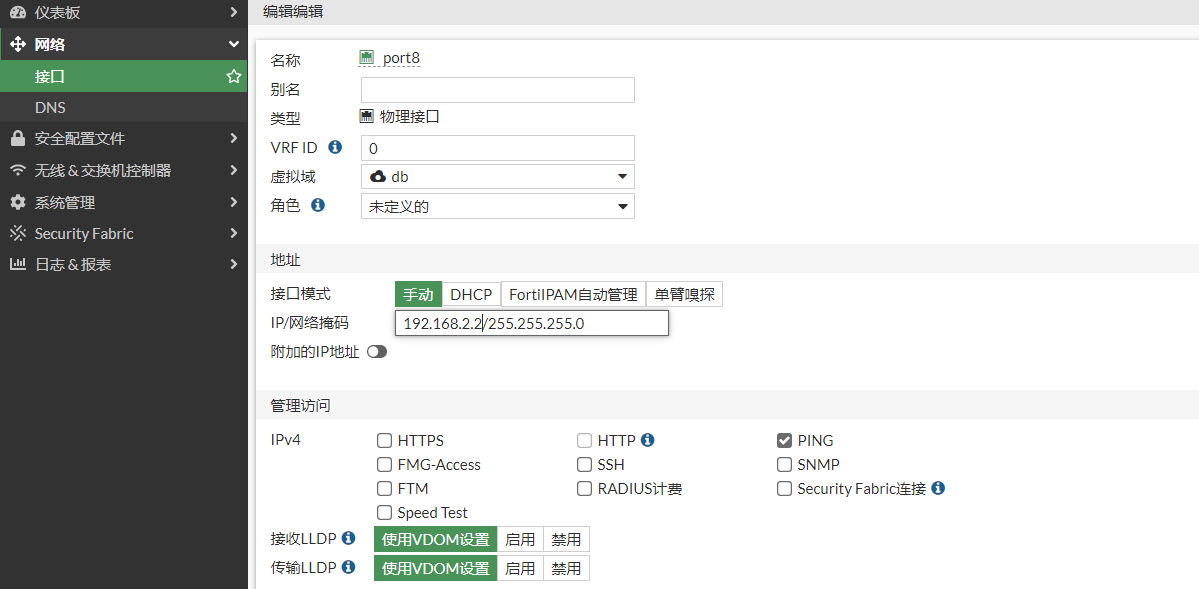
2.将接口划入 VDOM
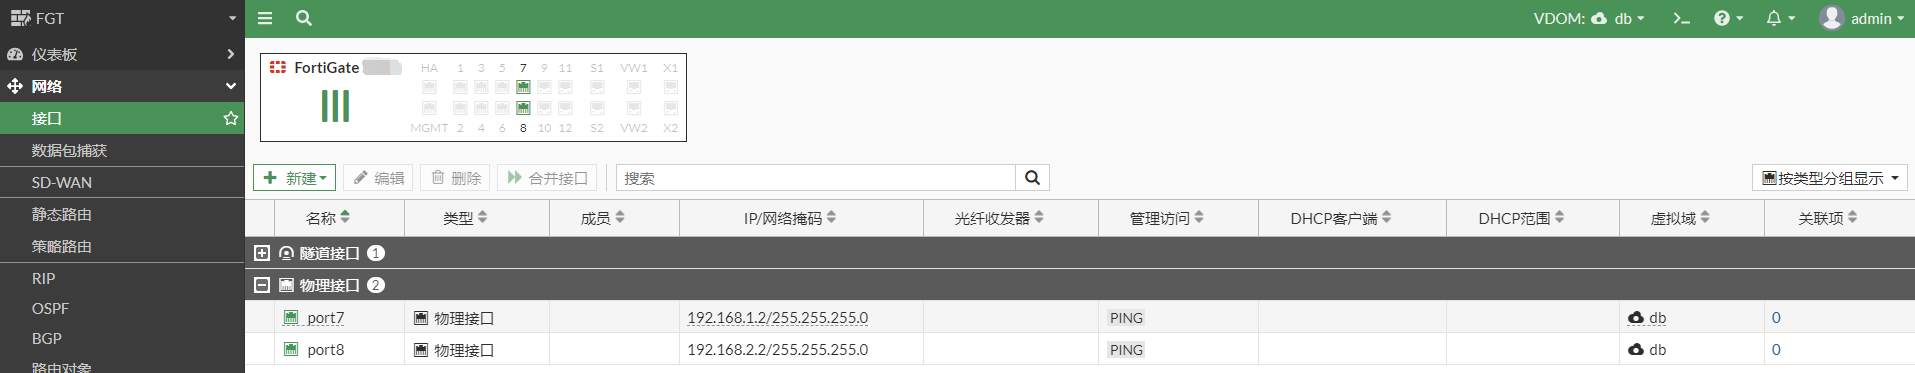
所有的接口默认都在 root VDOM 中,因此只需要将 port7 和 port8 划入 db vdom 即可。
查看 db vdom 中的接口。
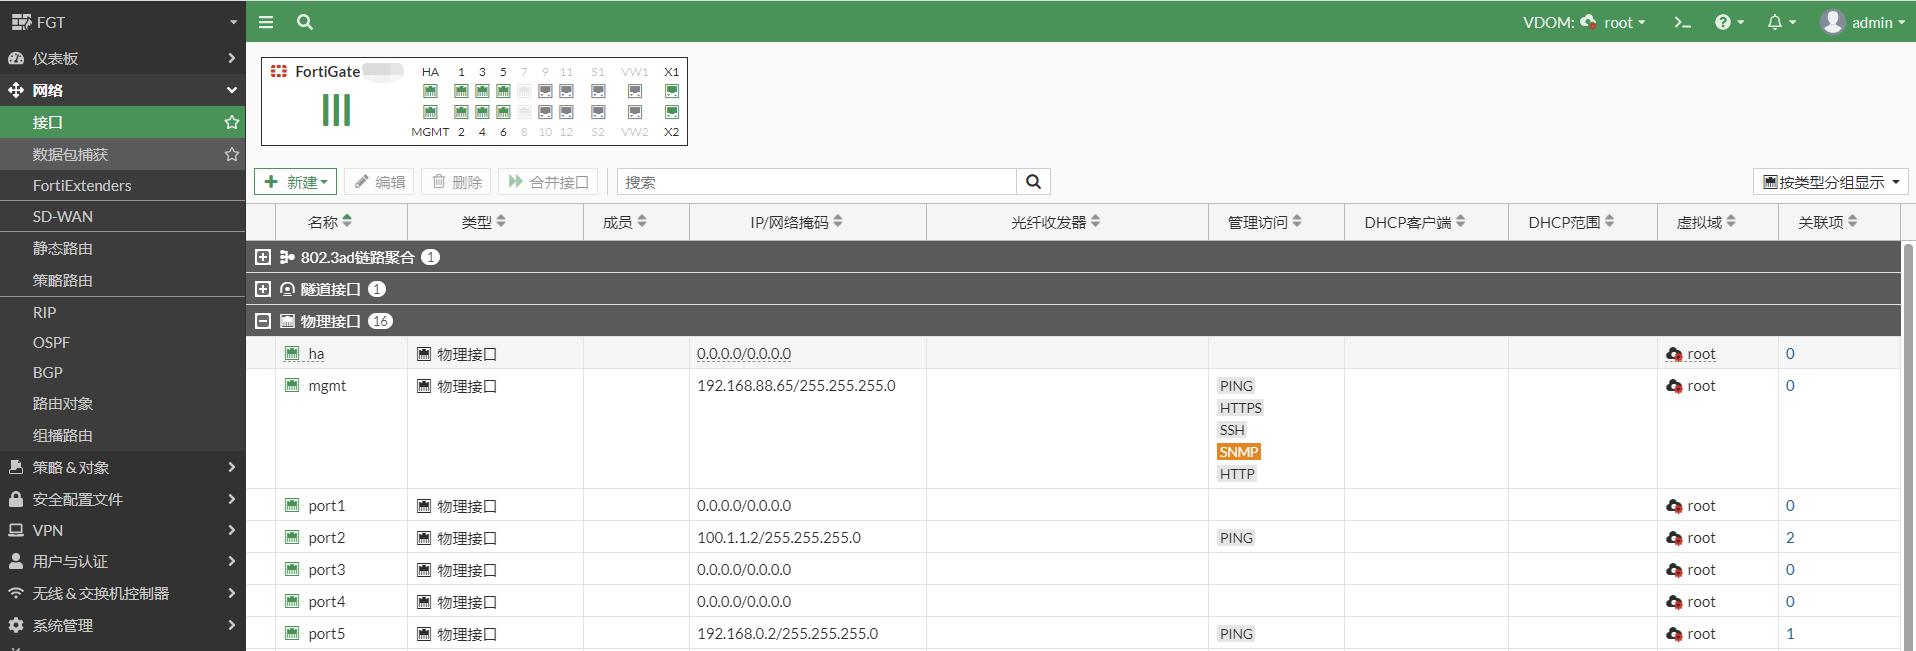
查看 root vdom 中的接口。
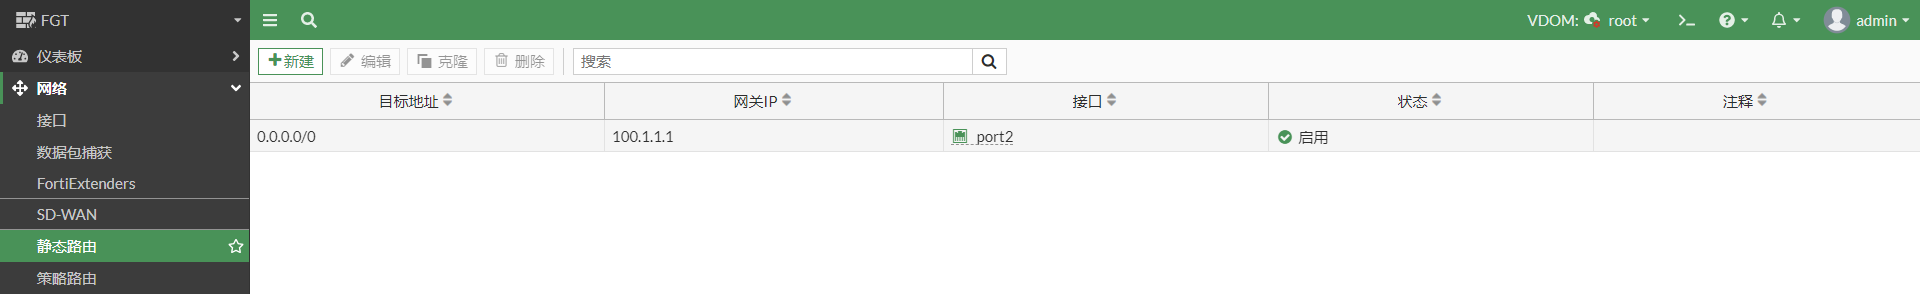
2.root vdom 配置路由和策略
配置路由。
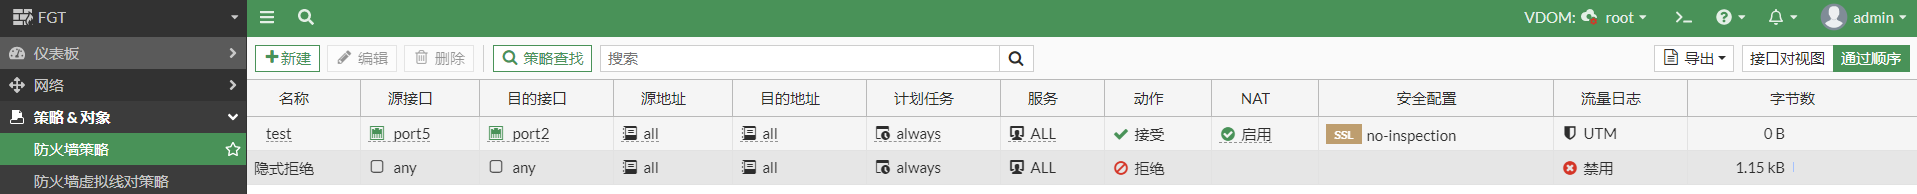
配置策略。
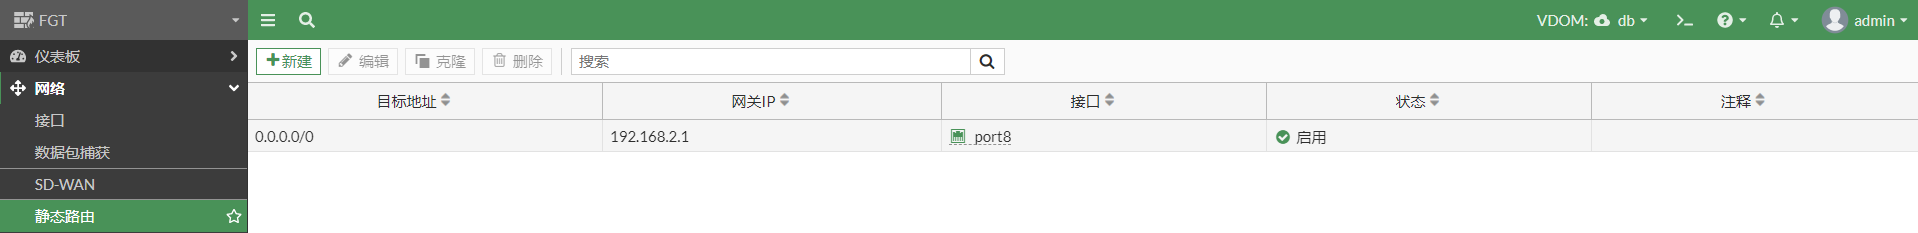
3.db vdom 配置路由和策略
配置路由。
配置策略。

业务测试
root vdom 测试
查看 root vdom 路由表
进入root vdom
#config vdom
#edit root

# get router info routing-table  all
Codes: K - kernel, C - connected, S - static, R - RIP, B - BGP
       O - OSPF, IA - OSPF inter area
       N1 - OSPF NSSA external type 1, N2 - OSPF NSSA external type 2
       E1 - OSPF external type 1, E2 - OSPF external type 2
       i - IS-IS, L1 - IS-IS level-1, L2 - IS-IS level-2, ia - IS-IS inter area
       * - candidate default

Routing table for VRF=0
S*      0.0.0.0/0 [10/0] via 100.1.1.1, port2, [1/0]
C       100.1.1.0/24 is directly connected, port2
C       192.168.0.0/24 is directly connected, port5
2.业务测试
PC1 ping 114.114.114.114
PC1# ping 114.114.114.114
PING 114.114.114.114 (114.114.114.114) 56(84) bytes of data.
64 bytes from 114.114.114.114: icmp_seq=1 ttl=64 time=23.2 ms
64 bytes from 114.114.114.114: icmp_seq=2 ttl=82 time=23.3 ms
64 bytes from 114.114.114.114: icmp_seq=3 ttl=79 time=23.3 ms
64 bytes from 114.114.114.114: icmp_seq=4 ttl=78 time=23.4 ms
64 bytes from 114.114.114.114: icmp_seq=5 ttl=77 time=23.1 ms
FortiGate 抓包
进入root vdom
#config vdom
#edit root

抓包
# diagnose sniffer packet any icmp 4
interfaces=[any]
filters=[icmp]
1.674117 port5 in 192.168.0.10 -> 114.114.114.114: icmp: echo request
1.674142 port2 out 100.1.1.2 -> 114.114.114.114: icmp: echo request
1.697234 port2 in 114.114.114.114 -> 100.1.1.2: icmp: echo reply
1.697242 port5 out 114.114.114.114 -> 192.168.0.10: icmp: echo reply
FortiGate 查看会话
进入vdom
#config vdom
#edit root

查看会话
#diagnose sys session filter proto 1
#diagnose sys session filter vd-name root
#diagnose sys session list

该会话的vdom索引是0,即vd=0,通过diagnose sys vd list查看vdom索引,root vdom的索引是0
session info: proto=1 proto_state=00 duration=1 expire=59 timeout=0 flags=00000000 socktype=0 sockport=0 av_idx=0 use=3
origin-shaper=
reply-shaper=
per_ip_shaper=
class_id=0 ha_id=0 policy_dir=0 tunnel=/ vlan_cos=0/255
state=may_dirty npu
statistic(bytes/packets/allow_err): org=168/2/1 reply=168/2/1 tuples=2
tx speed(Bps/kbps): 0/0 rx speed(Bps/kbps): 0/0
orgin->sink: org pre->post, reply pre->post dev=13->10/10->13 gwy=100.1.1.1/192.168.0.10
hook=post dir=org act=snat 192.168.0.10:3646->114.114.114.114:8(100.1.1.2:64062)
hook=pre dir=reply act=dnat 114.114.114.114:64062->100.1.1.2:0(192.168.0.10:3646)
misc=0 policy_id=3 pol_uuid_idx=515 auth_info=0 chk_client_info=0 vd=0
serial=0003413a tos=ff/ff app_list=0 app=0 url_cat=0
rpdb_link_id=00000000 ngfwid=n/a
npu_state=0x4000c00 ofld-O ofld-R
npu info: flag=0x81/0x81, offload=8/8, ips_offload=0/0, epid=150/156, ipid=156/150, vlan=0x0000/0x0000
vlifid=156/150, vtag_in=0x0000/0x0000 in_npu=1/1, out_npu=1/1, fwd_en=0/0, qid=0/3

进入全局,查看vdom索引
#config global
# diagnose sys vd list | grep name=root
name=root/root index=0 enabled fib_ver=36 rpdb_ver=2 use=168 rt_num=48 asym_rt=0 sip_helper=0, sip_nat_trace=1, mc_fwd=0, mc_ttl_nc=0, tpmc_sk_pl=0
db vdom 测试
1.查看路由表
进入db vdom
#config vdom
#edit db

查看路由表
# get router info routing-table  all
Codes: K - kernel, C - connected, S - static, R - RIP, B - BGP
       O - OSPF, IA - OSPF inter area
       N1 - OSPF NSSA external type 1, N2 - OSPF NSSA external type 2
       E1 - OSPF external type 1, E2 - OSPF external type 2
       i - IS-IS, L1 - IS-IS level-1, L2 - IS-IS level-2, ia - IS-IS inter area
       * - candidate default

Routing table for VRF=0
S*      0.0.0.0/0 [10/0] via 192.168.2.1, port8, [1/0]
C       192.168.1.0/24 is directly connected, port7
C 192.168.2.0/24 is directly connected, port82.业务测试
PC2 ping DB Server
PC2# ping 192.168.91.201
PING 192.168.91.201 (192.168.91.201) 56(84) bytes of data.
64 bytes from 192.168.91.201: icmp_seq=1 ttl=61 time=0.898 ms
64 bytes from 192.168.91.201: icmp_seq=2 ttl=61 time=1.05 ms
64 bytes from 192.168.91.201: icmp_seq=3 ttl=61 time=0.935 ms
64 bytes from 192.168.91.201: icmp_seq=4 ttl=61 time=0.687 ms

--- 192.168.91.201 ping statistics ---
4 packets transmitted, 4 received, 0% packet loss, time 3002ms
rtt min/avg/max/mdev = 0.687/0.892/1.050/0.134 ms
FortiGate 抓包
进入db vdom
#config vdom
#edit db

查看路由表
# diagnose sniffer packet any icmp 4
interfaces=[any]
filters=[icmp]
2.484117 port7 in 192.168.1.10 -> 192.168.91.201: icmp: echo request
2.484133 port8 out 192.168.1.10 -> 192.168.91.201: icmp: echo request
2.484914 port8 in 192.168.91.201 -> 192.168.1.10: icmp: echo reply
2.485049 port7 out 192.168.91.201 -> 192.168.1.10: icmp: echo reply
FortiGate 查看会话
进入db vdom
#config vdom
#edit db

查看会话
# diagnose sys session filter proto 1
# diagnose sys session filter vd-name db
# diagnose sys session list

该会话的vdom索引是3,即vd=3,通过diagnose sys vd list查看vdom索引,db vdom的索引是3
session info: proto=1 proto_state=00 duration=1 expire=59 timeout=0 flags=00000000 socktype=0 sockport=0 av_idx=0 use=3
origin-shaper=
reply-shaper=
per_ip_shaper=
class_id=0 ha_id=0 policy_dir=0 tunnel=/ vlan_cos=0/255
state=may_dirty npu
statistic(bytes/packets/allow_err): org=168/2/1 reply=168/2/1 tuples=2
tx speed(Bps/kbps): 0/0 rx speed(Bps/kbps): 0/0
orgin->sink: org pre->post, reply pre->post dev=15->16/16->15 gwy=192.168.2.1/192.168.1.10
hook=pre dir=org act=noop 192.168.1.10:2605->192.168.91.201:8(0.0.0.0:0)
hook=post dir=reply act=noop 192.168.91.201:2605->192.168.1.10:0(0.0.0.0:0)
misc=0 policy_id=1 pol_uuid_idx=617 auth_info=0 chk_client_info=0 vd=3
serial=0003466c tos=ff/ff app_list=0 app=0 url_cat=0
rpdb_link_id=00000000 ngfwid=n/a
npu_state=0x4000c00 ofld-O ofld-R
npu info: flag=0x81/0x81, offload=8/8, ips_offload=0/0, epid=162/160, ipid=160/162, vlan=0x0000/0x0000
vlifid=160/162, vtag_in=0x0000/0x0000 in_npu=1/1, out_npu=1/1, fwd_en=0/0, qid=3/2

进入全局,查看vdom索引
#config global
# diagnose sys vd list | grep name=db
name=db/db index=3 enabled fib_ver=23 rpdb_ver=0 use=62 rt_num=7 asym_rt=0 sip_helper=0, sip_nat_trace=1, mc_fwd=0, mc_ttl_nc=0, tpmc_sk_pl=0