基于带宽的 Maximize Bandwidth (SLA)
基于带宽的 Maximize Bandwidth (SLA)
重要
ADVPN 目前不支持 Maximize Bandwidth (SLA) 模式。
原理介绍
FGT 监控每个接口的带宽,每秒更新一次,SDWAN 成员的优先级根据可用带宽从高到低排序。当流量匹配到该规则时,FGT 将选择第一个成员进行转发。
Maximize Bandwidth 有三种基于带宽的算法:
FortiGate # config system sdwan
FortiGate # config service
FortiGate # edit 1
FortiGate # set hash-mode ?

round-robin             All traffic are distributed to selected interfaces in equal portions and circular order.
source-ip-based         All traffic from a source IP is sent to the same interface.
source-dest-ip-based    All traffic from a source IP to a destination IP is sent to the same interface.
inbandwidth             All traffic are distributed to a selected interface with most available bandwidth for incoming traffic.
outbandwidth            All traffic are distributed to a selected interface with most available bandwidth for outgoing traffic.
bibandwidth             All traffic are distributed to a selected interface with most available bandwidth for both incoming and outgoing traffic.
网络拓扑
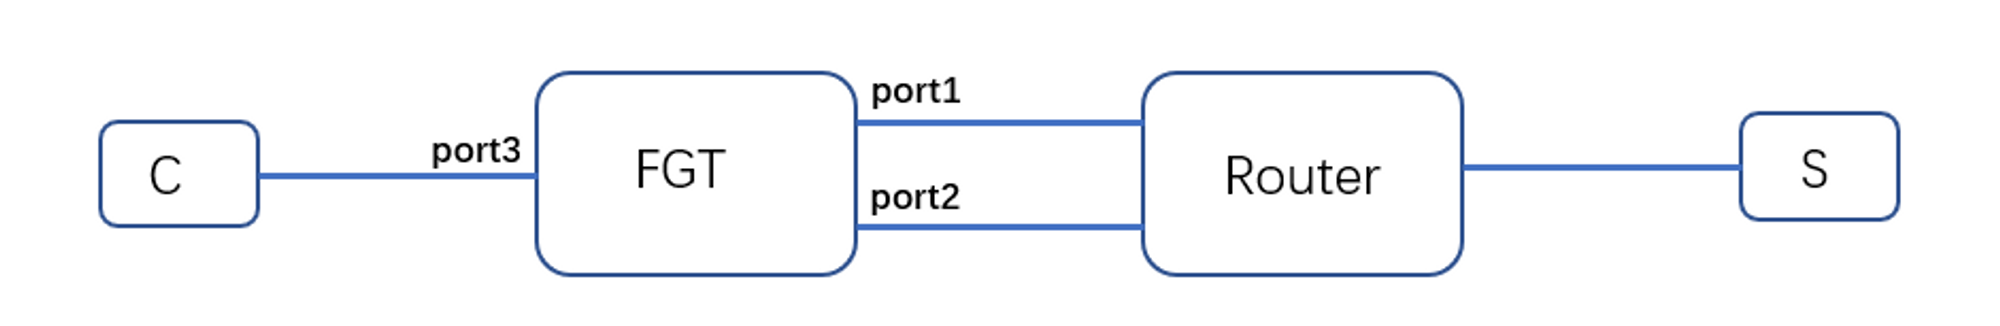
配置步骤
配置预估带宽。
config system interface
    edit "port1"
        set ip 202.101.1.1 255.255.255.0
        set estimated-upstream-bandwidth 200000
        set estimated-downstream-bandwidth 200000
    next
    edit "port2"
        set ip 202.101.2.1 255.255.255.0
        set estimated-upstream-bandwidth 100000
        set estimated-downstream-bandwidth 100000
    next
end
配置 SD-WAN。
config system sdwan
    set status enable
    config zone
        edit "Internet"
        next
    end
    config members
        edit 1
            set interface "port1"
            set zone "Internet"
            set gateway 202.101.1.2
        next
        edit 2
            set interface "port2"
            set zone "Internet"
            set gateway 202.101.2.2
        next
    end
    config health-check
        edit "100.100.100.1"
            set server "100.100.100.1"
            set members 0
            config sla
                edit 1
                    set latency-threshold 100
                    set jitter-threshold 100
                next
            end
        next
    end
config service
    edit 1
        set name "test1"
        set mode load-balance
        set hash-mode inbandwidth
        set dst "all"
        set src "10.0.0.0/8"
        config sla
            edit "100.100.100.1"
                set id 1
            next
        end
        set priority-members 1 2
        next
    end
end
配置上网策略。
config firewall policy
    edit 3
        set srcintf "port3"
        set dstintf "Internet"
        set srcaddr "all"
        set dstaddr "all"
        set action accept
        set schedule "always"
        set service "ALL"
    next
end
负载方法说明
当 hash-mode 是 inbandwidth 时,sdwan 只监控 inbandwith 的带宽,可以在接口下只配置:estimated-downstream-bandwidth。如下所示,初始 port1 剩余带宽 200M,port2 剩余带宽 100M,port1 优先。
FortiGate # diagnose sys sdwan service

Service(1): Address Mode(IPV4) flags=0x200
Gen(1), TOS(0x0/0x0), Protocol(0: 1->65535), Mode(load-balance hash-mode=inbandwidth)
Members(2):
1: Seq_num(1 port1), alive, sla(0x1), gid(2), num of pass(1), inbandwidth: 199991Kbps, selected  //port1优先//
2: Seq_num(2 port2), alive, sla(0x1), gid(2), num of pass(1), inbandwidth: 99993Kbps, selected
Src address(1):
10.0.0.0-10.255.255.255

Dst address(1):
0.0.0.0-255.255.255.255
当 hash-mode 是 outbandwidth 时,sdwan 只监控 outbandwith 的带宽,可以在接口下只配置:estimated-upstream-bandwidth。
diagnose sys sdwan service

Service(1): Address Mode(IPV4) flags=0x200
Gen(1), TOS(0x0/0x0), Protocol(0: 1->65535), Mode(load-balance hash-mode=outbandwidth)
Members(2):
1: Seq_num(1 port1), alive, sla(0x1), gid(2), num of pass(1), outbandwidth: 199997Kbps, selected //port1优先//
2: Seq_num(2 port2), alive, sla(0x1), gid(2), num of pass(1), outbandwidth: 99999Kbps, selected
Src address(1):
10.0.0.0-10.255.255.255

Dst address(1):
0.0.0.0-255.255.255.255
当 hash-mode 是 bibandwidth 时,sdwan 监控的是 inbandwidth 和 outbandwith 的带宽之和,需要配置:estimated-upstream-bandwidth 和 estimated-downstream-bandwidth。
diagnose sys sdwan service

Service(1): Address Mode(IPV4) flags=0x200
Gen(1), TOS(0x0/0x0), Protocol(0: 1->65535), Mode(load-balance hash-mode=bibandwidth)
Members(2):
1: Seq_num(1 port1), alive, sla(0x1), gid(2), num of pass(1), bibandwidth: 399988Kbps, selected //port1优先//
2: Seq_num(2 port2), alive, sla(0x1), gid(2), num of pass(1), bibandwidth: 199992Kbps, selected
Src address(1):
10.0.0.0-10.255.255.255

Dst address(1):
0.0.0.0-255.255.255.255
效果验证
iPerf 测试
使用 iperf 测试,hash-mode 设置为 outbandwidth,因为 iperf 打流是 upload。
server命令:iperf3 -s   //默认监听端口5201//
client命令:iperf3 -c 100.100.100.2 -t 6000 -b 150M
iperf 第 1 条流 150M。
# iperf3 -c 100.100.100.2 -b 150M -t 6000  //client记录
Connecting to host 100.100.100.2, port 5201
[  4] local 10.1.1.2 port 50470 connected to 100.100.100.2 port 5201
[ ID] Interval           Transfer     Bandwidth       Retr  Cwnd
[  4]   0.00-1.00   sec  16.2 MBytes   136 Mbits/sec    0    389 KBytes
[  4]   1.00-2.00   sec  17.9 MBytes   150 Mbits/sec    0    389 KBytes
[  4]   2.00-3.00   sec  17.9 MBytes   150 Mbits/sec    0    389 KBytes
[  4]   3.00-4.00   sec  17.9 MBytes   150 Mbits/sec    0    389 KBytes
[  4]   4.00-5.00   sec  17.9 MBytes   150 Mbits/sec    0    400 KBytes
[  4]   5.00-6.00   sec  17.9 MBytes   150 Mbits/sec    0    400 KBytes
[  4]   6.00-7.00   sec  17.9 MBytes   150 Mbits/sec    0    400 KBytes
[  4]   7.00-8.00   sec  17.9 MBytes   150 Mbits/sec    0    400 KBytes
SDWAN 监控,手动每隔 10s,敲一次
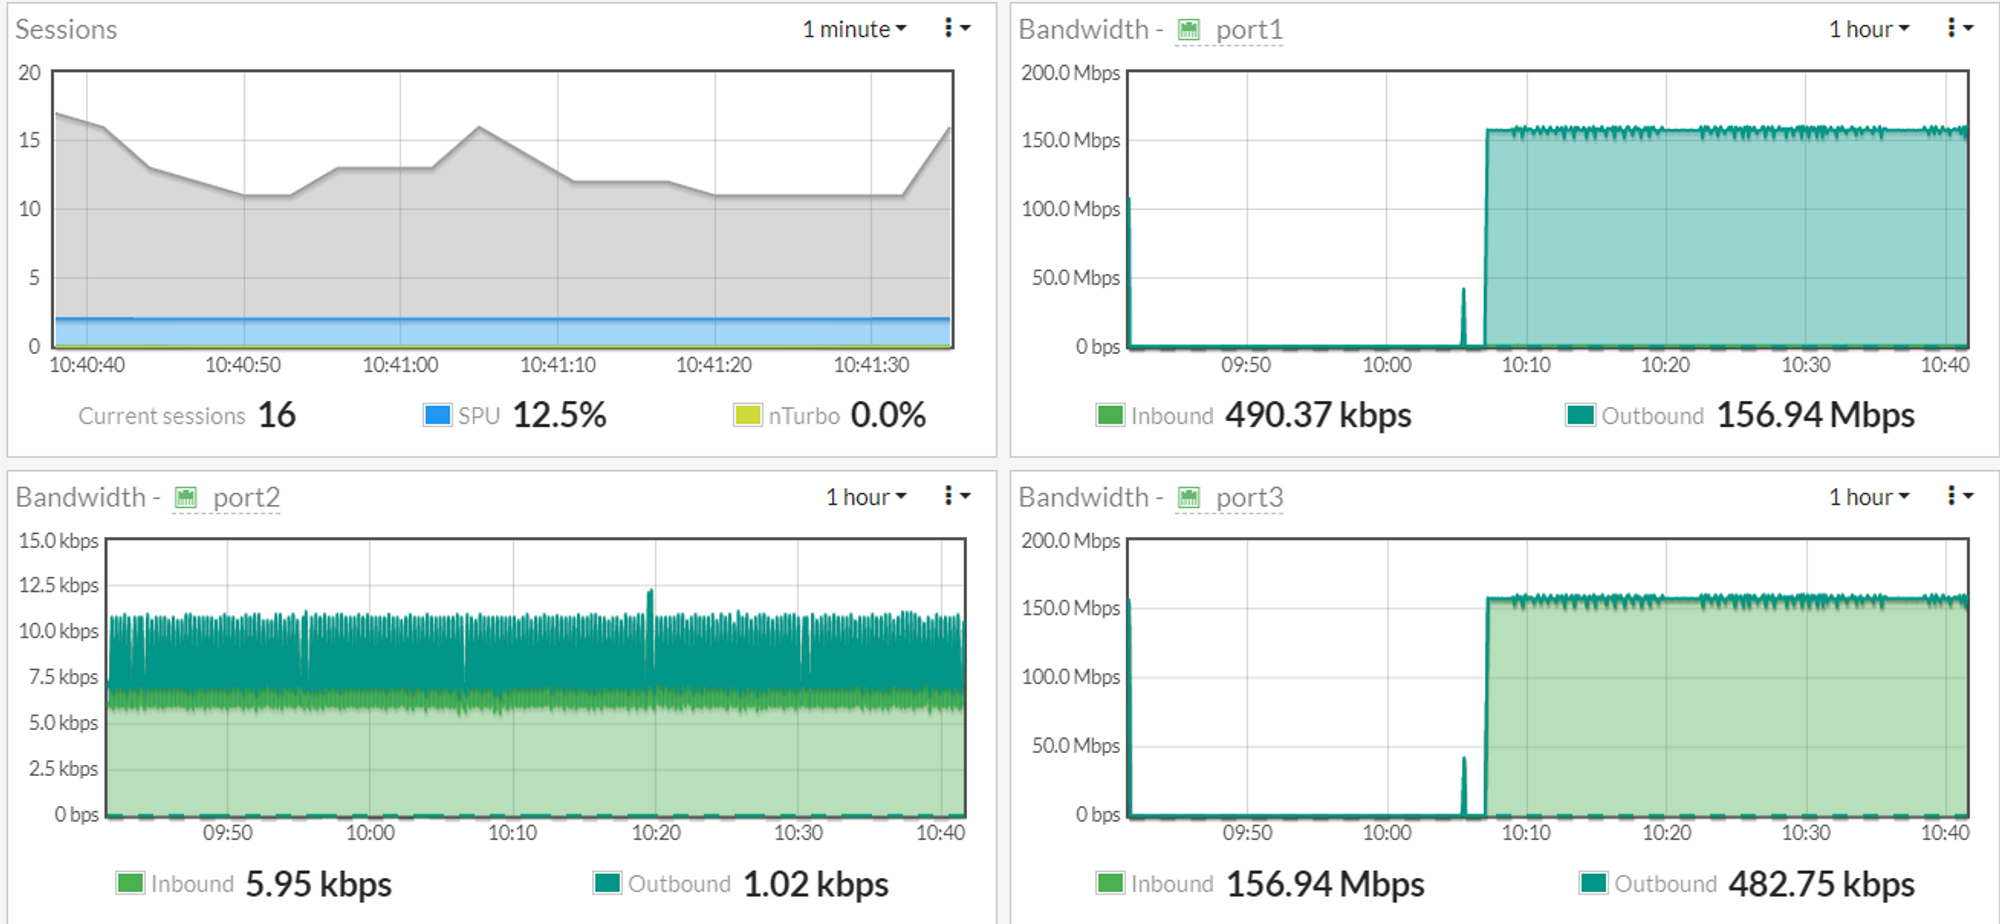
diagnose sys sdwan service查看接口的带宽及 SDWAN 的排序,SDWAN 逐渐监测到接口使用了 150M 的带宽,约为 60s。# diagnose sys sdwan service //初始 Service(1): Address Mode(IPV4) flags=0x200 Gen(5), TOS(0x0/0x0), Protocol(0: 1->65535), Mode(load-balance hash-mode=outbandwidth) Members(2): 1: Seq_num(1 port1), alive, sla(0x1), gid(2), num of pass(1), outbandwidth: 199997Kbps, selected //port1剩余的可用带宽多,port1优先 2: Seq_num(2 port2), alive, sla(0x1), gid(2), num of pass(1), outbandwidth: 99999Kbps, selected Src address(1): 10.0.0.0-10.255.255.255 Dst address(1): 0.0.0.0-255.255.255.255 # diagnose sys sdwan service //10s Service(1): Address Mode(IPV4) flags=0x200 Gen(5), TOS(0x0/0x0), Protocol(0: 1->65535), Mode(load-balance hash-mode=outbandwidth) Members(2): 1: Seq_num(1 port1), alive, sla(0x1), gid(2), num of pass(1), outbandwidth: 171669Kbps, selected 2: Seq_num(2 port2), alive, sla(0x1), gid(2), num of pass(1), outbandwidth: 99999Kbps, selected Src address(1): 10.0.0.0-10.255.255.255 Dst address(1): 0.0.0.0-255.255.255.255 # diagnose sys sdwan service //20s Service(1): Address Mode(IPV4) flags=0x200 Gen(5), TOS(0x0/0x0), Protocol(0: 1->65535), Mode(load-balance hash-mode=outbandwidth) Members(2): 1: Seq_num(1 port1), alive, sla(0x1), gid(2), num of pass(1), outbandwidth: 140229Kbps, selected 2: Seq_num(2 port2), alive, sla(0x1), gid(2), num of pass(1), outbandwidth: 99999Kbps, selected Src address(1): 10.0.0.0-10.255.255.255 Dst address(1): 0.0.0.0-255.255.255.255 # diagnose sys sdwan service //30s Service(1): Address Mode(IPV4) flags=0x200 Gen(5), TOS(0x0/0x0), Protocol(0: 1->65535), Mode(load-balance hash-mode=outbandwidth) Members(2): 1: Seq_num(1 port1), alive, sla(0x1), gid(2), num of pass(1), outbandwidth: 108768Kbps, selected 2: Seq_num(2 port2), alive, sla(0x1), gid(2), num of pass(1), outbandwidth: 99999Kbps, selected Src address(1): 10.0.0.0-10.255.255.255 Dst address(1): 0.0.0.0-255.255.255.255 # diagnose sys sdwan service //40s Service(1): Address Mode(IPV4) flags=0x200 Gen(6), TOS(0x0/0x0), Protocol(0: 1->65535), Mode(load-balance hash-mode=outbandwidth) Members(2): 1: Seq_num(2 port2), alive, sla(0x1), gid(2), num of pass(1), outbandwidth: 99999Kbps, selected //port2剩余的可用带宽超过port1,port优先 2: Seq_num(1 port1), alive, sla(0x1), gid(2), num of pass(1), outbandwidth: 77328Kbps, selected Src address(1): 10.0.0.0-10.255.255.255 Dst address(1): 0.0.0.0-255.255.255.255 # diagnose sys sdwan service //50s Service(1): Address Mode(IPV4) flags=0x200 Gen(6), TOS(0x0/0x0), Protocol(0: 1->65535), Mode(load-balance hash-mode=outbandwidth) Members(2): 1: Seq_num(2 port2), alive, sla(0x1), gid(2), num of pass(1), outbandwidth: 99999Kbps, selected 2: Seq_num(1 port1), alive, sla(0x1), gid(2), num of pass(1), outbandwidth: 45866Kbps, selected Src address(1): 10.0.0.0-10.255.255.255 Dst address(1): 0.0.0.0-255.255.255.255 # diagnose sys sdwan service //60s Service(1): Address Mode(IPV4) flags=0x200 Gen(6), TOS(0x0/0x0), Protocol(0: 1->65535), Mode(load-balance hash-mode=outbandwidth) Members(2): 1: Seq_num(2 port2), alive, sla(0x1), gid(2), num of pass(1), outbandwidth: 99999Kbps, selected 2: Seq_num(1 port1), alive, sla(0x1), gid(2), num of pass(1), outbandwidth: 42754Kbps, selected //1分钟的时间,port1的带宽监测到使用了150M,剩余40多M Src address(1): 10.0.0.0-10.255.255.255 Dst address(1): 0.0.0.0-255.255.255.255查看接口流量图和会话,第 1 条 iperf 的流从 port1 转发。
查看会话列表。
# diagnose sys session list
session info: proto=6 proto_state=01 duration=1534 expire=3590 timeout=3600 flags=00000000 socktype=0 sockport=0 av_idx=0 use=3
class_id=0 ha_id=0 policy_dir=0 tunnel=/ vlan_cos=0/255
state=may_dirty npu
statistic(bytes/packets/allow_err): org=112/2/1 reply=60/1/1 tuples=2
tx speed(Bps/kbps): 0/0 rx speed(Bps/kbps): 0/0
orgin->sink: org pre->post, reply pre->post dev=11->9/9->11 gwy=202.101.1.2/10.1.1.2
hook=pre dir=org act=noop 10.1.1.2:50482->100.100.100.2:5201(0.0.0.0:0)
hook=post dir=reply act=noop 100.100.100.2:5201->10.1.1.2:50482(0.0.0.0:0)
pos/(before,after) 0/(0,0), 0/(0,0)
misc=0 policy_id=4 auth_info=0 chk_client_info=0 vd=0
serial=00731dbb tos=ff/ff app_list=0 app=0 url_cat=0
sdwan_mbr_seq=1 sdwan_service_id=1
rpdb_link_id=ff000001 rpdb_svc_id=0 ngfwid=n/a
npu_state=0x000c00
npu info: flag=0x81/0x81, offload=8/8, ips_offload=0/0, epid=132/136, ipid=136/132, vlan=0x0000/0x0000
vlifid=136/132, vtag_in=0x0000/0x0000 in_npu=1/1, out_npu=1/1, fwd_en=0/0, qid=1/1
session info: proto=6 proto_state=01 duration=1534 expire=2065 timeout=3600 flags=00000000 socktype=0 sockport=0 av_idx=0 use=3
class_id=0 ha_id=0 policy_dir=0 tunnel=/ vlan_cos=0/255
state=may_dirty npu
statistic(bytes/packets/allow_err): org=112/2/1 reply=112/2/1 tuples=2
tx speed(Bps/kbps): 0/0 rx speed(Bps/kbps): 0/0
orgin->sink: org pre->post, reply pre->post dev=11->9/9->11 gwy=202.101.1.2/10.1.1.2
hook=pre dir=org act=noop 10.1.1.2:50480->100.100.100.2:5201(0.0.0.0:0)
hook=post dir=reply act=noop 100.100.100.2:5201->10.1.1.2:50480(0.0.0.0:0)
pos/(before,after) 0/(0,0), 0/(0,0)
misc=0 policy_id=4 auth_info=0 chk_client_info=0 vd=0
serial=00731dba tos=ff/ff app_list=0 app=0 url_cat=0
sdwan_mbr_seq=1 sdwan_service_id=1
rpdb_link_id=ff000001 rpdb_svc_id=0 ngfwid=n/a
npu_state=0x000c00
npu info: flag=0x81/0x81, offload=8/8, ips_offload=0/0, epid=132/136, ipid=136/132, vlan=0x0000/0x0000
vlifid=136/132, vtag_in=0x0000/0x0000 in_npu=1/1, out_npu=1/1, fwd_en=0/0, qid=5/5
total session 2

# diagnose netlink interface list  | grep port1
if=port1 family=00 type=1 index=9 mtu=1500 link=0 master=0
使用 diagnose sys sdwan intf-sla-log port1 查看 port1 监控的带宽也是一样的效果,逐渐查看到 port1 的带宽消耗了 150M。
#diagnose sys sdwan intf-sla-log port1
Timestamp: Wed Dec 15 17:38:11 2021, used inbandwidth: 78029bps, used outbandwidth: 5949335bps, used bibandwidth: 6027364bps, tx bytes: 4837359868bytes, rx bytes: 20421280bytes.
Timestamp: Wed Dec 15 17:38:21 2021, used inbandwidth: 206010bps, used outbandwidth: 37408566bps, used bibandwidth: 37614576bps, tx bytes: 5034405643bytes, rx bytes: 21255211bytes.
Timestamp: Wed Dec 15 17:38:31 2021, used inbandwidth: 315768bps, used outbandwidth: 68591735bps, used bibandwidth: 68907503bps, tx bytes: 5229856283bytes, rx bytes: 21990459bytes.
Timestamp: Wed Dec 15 17:38:41 2021, used inbandwidth: 455947bps, used outbandwidth: 100163534bps, used bibandwidth: 100619481bps, tx bytes: 5427312580bytes, rx bytes: 22883469bytes.
Timestamp: Wed Dec 15 17:38:51 2021, used inbandwidth: 564881bps, used outbandwidth: 131613259bps, used bibandwidth: 132178140bps, tx bytes: 5624002692bytes, rx bytes: 23577318bytes.
Timestamp: Wed Dec 15 17:39:01 2021, used inbandwidth: 628638bps, used outbandwidth: 157006755bps, used bibandwidth: 157635393bps, tx bytes: 5818652090bytes, rx bytes: 24350270bytes.
iperf 打第 2 条流 80M。
server命令:iperf3 -s -p 5202
client命令:iperf3 -c 100.100.100.2 -t 6000 -b 80M -p 5202
SDWAN 监控,查看接口的带宽及 SDWAN 的排序。
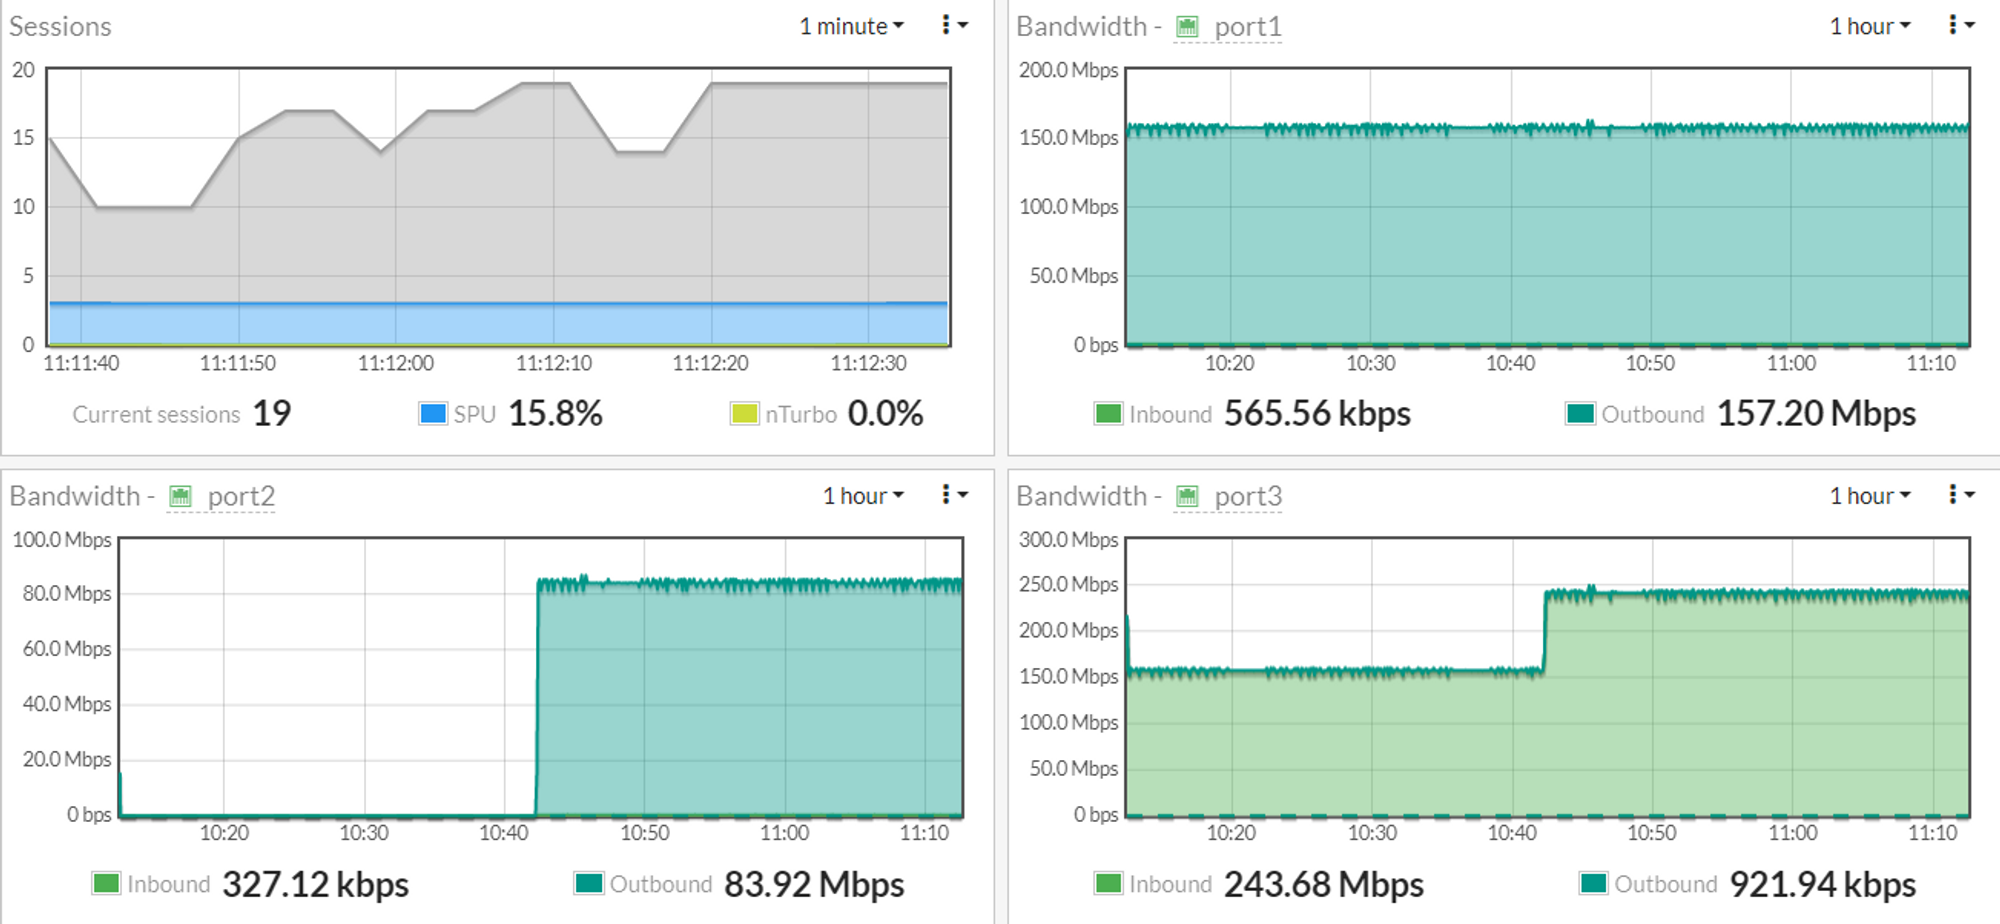
# diagnose sys sdwan service
Service(1): Address Mode(IPV4) flags=0x200
  Gen(6), TOS(0x0/0x0), Protocol(0: 1->65535), Mode(load-balance hash-mode=outbandwidth)
  Members(2):
    1: Seq_num(2 port2), alive, sla(0x1), gid(2), num of pass(1), outbandwidth: 99999Kbps, selected //开始打第2条流前,port2优先
    2: Seq_num(1 port1), alive, sla(0x1), gid(2), num of pass(1), outbandwidth: 42732Kbps, selected
  Src address(1):
        10.0.0.0-10.255.255.255
  Dst address(1):
        0.0.0.0-255.255.255.255

 # diagnose sys sdwan service
Service(1): Address Mode(IPV4) flags=0x200
  Gen(6), TOS(0x0/0x0), Protocol(0: 1->65535), Mode(load-balance hash-mode=outbandwidth)
  Members(2):
    1: Seq_num(2 port2), alive, sla(0x1), gid(2), num of pass(1), outbandwidth: 76158Kbps, selected
    2: Seq_num(1 port1), alive, sla(0x1), gid(2), num of pass(1), outbandwidth: 42754Kbps, selected
  Src address(1):
        10.0.0.0-10.255.255.255
  Dst address(1):
        0.0.0.0-255.255.255.255

 # diagnose sys sdwan service
Service(1): Address Mode(IPV4) flags=0x200
  Gen(6), TOS(0x0/0x0), Protocol(0: 1->65535), Mode(load-balance hash-mode=outbandwidth)
  Members(2):
    1: Seq_num(2 port2), alive, sla(0x1), gid(2), num of pass(1), outbandwidth: 59404Kbps, selected
    2: Seq_num(1 port1), alive, sla(0x1), gid(2), num of pass(1), outbandwidth: 43062Kbps, selected
  Src address(1):
        10.0.0.0-10.255.255.255
  Dst address(1):
        0.0.0.0-255.255.255.255

 # diagnose sys sdwan service
Service(1): Address Mode(IPV4) flags=0x200
  Gen(6), TOS(0x0/0x0), Protocol(0: 1->65535), Mode(load-balance hash-mode=outbandwidth)
  Members(2):
    1: Seq_num(2 port2), alive, sla(0x1), gid(2), num of pass(1), outbandwidth: 42453Kbps, selected
    2: Seq_num(1 port1), alive, sla(0x1), gid(2), num of pass(1), outbandwidth: 42424Kbps, selected
  Src address(1):
        10.0.0.0-10.255.255.255
  Dst address(1):
        0.0.0.0-255.255.255.255

 # diagnose sys sdwan service
Service(1): Address Mode(IPV4) flags=0x200
  Gen(7), TOS(0x0/0x0), Protocol(0: 1->65535), Mode(load-balance hash-mode=outbandwidth)
  Members(2):
    1: Seq_num(1 port1), alive, sla(0x1), gid(2), num of pass(1), outbandwidth: 42832Kbps, selected  //port1剩余的可用带宽多,port1变优先
    2: Seq_num(2 port2), alive, sla(0x1), gid(2), num of pass(1), outbandwidth: 25853Kbps, selected
  Src address(1):
        10.0.0.0-10.255.255.255
  Dst address(1):
        0.0.0.0-255.255.255.255

 # diagnose sys sdwan service
Service(1): Address Mode(IPV4) flags=0x200
  Gen(7), TOS(0x0/0x0), Protocol(0: 1->65535), Mode(load-balance hash-mode=outbandwidth)
  Members(2):
    1: Seq_num(1 port1), alive, sla(0x1), gid(2), num of pass(1), outbandwidth: 42832Kbps, selected
    2: Seq_num(2 port2), alive, sla(0x1), gid(2), num of pass(1), outbandwidth: 25853Kbps, selected
  Src address(1):
        10.0.0.0-10.255.255.255
  Dst address(1):
        0.0.0.0-255.255.255.255
查看接口流量图和会话,第 2 条 iperf 流从 port2 转发。第 1 条 iperf 流无变化。
查看会话列表。
# diagnose sys session list
session info: proto=6 proto_state=01 duration=478 expire=3121 timeout=3600 flags=00000000 socktype=0 sockport=0 av_idx=0 use=3
origin-shaper=
reply-shaper=
per_ip_shaper=
class_id=0 ha_id=0 policy_dir=0 tunnel=/ vlan_cos=0/255
state=may_dirty npu
statistic(bytes/packets/allow_err): org=112/2/1 reply=60/1/1 tuples=2
tx speed(Bps/kbps): 0/0 rx speed(Bps/kbps): 0/0
orgin->sink: org pre->post, reply pre->post dev=11->10/10->11 gwy=202.101.2.2/10.1.1.3
hook=pre dir=org act=noop 10.1.1.3:59558->100.100.100.2:5202(0.0.0.0:0)
hook=post dir=reply act=noop 100.100.100.2:5202->10.1.1.3:59558(0.0.0.0:0)
pos/(before,after) 0/(0,0), 0/(0,0)
misc=0 policy_id=4 auth_info=0 chk_client_info=0 vd=0
serial=0073229b tos=ff/ff app_list=0 app=0 url_cat=0
sdwan_mbr_seq=2 sdwan_service_id=1
rpdb_link_id=ff000001 rpdb_svc_id=0 ngfwid=n/a
npu_state=0x000c00
npu info: flag=0x81/0x81, offload=8/8, ips_offload=0/0, epid=134/136, ipid=136/134, vlan=0x0000/0x0000
vlifid=136/134, vtag_in=0x0000/0x0000 in_npu=1/1, out_npu=1/1, fwd_en=0/0, qid=2/2

session info: proto=6 proto_state=01 duration=478 expire=3590 timeout=3600 flags=00000000 socktype=0 sockport=0 av_idx=0 use=3
origin-shaper=
reply-shaper=
per_ip_shaper=
class_id=0 ha_id=0 policy_dir=0 tunnel=/ vlan_cos=0/255
state=may_dirty npu
statistic(bytes/packets/allow_err): org=112/2/1 reply=60/1/1 tuples=2
tx speed(Bps/kbps): 0/0 rx speed(Bps/kbps): 0/0
orgin->sink: org pre->post, reply pre->post dev=11->10/10->11 gwy=202.101.2.2/10.1.1.3
hook=pre dir=org act=noop 10.1.1.3:59560->100.100.100.2:5202(0.0.0.0:0)
hook=post dir=reply act=noop 100.100.100.2:5202->10.1.1.3:59560(0.0.0.0:0)
pos/(before,after) 0/(0,0), 0/(0,0)
misc=0 policy_id=4 auth_info=0 chk_client_info=0 vd=0
serial=0073229c tos=ff/ff app_list=0 app=0 url_cat=0
sdwan_mbr_seq=2 sdwan_service_id=1
rpdb_link_id=ff000001 rpdb_svc_id=0 ngfwid=n/a
npu_state=0x000c00
npu info: flag=0x81/0x81, offload=8/8, ips_offload=0/0, epid=134/136, ipid=136/134, vlan=0x0000/0x0000
vlifid=136/134, vtag_in=0x0000/0x0000 in_npu=1/1, out_npu=1/1, fwd_en=0/0, qid=6/6
total session 2

# diagnose netlink interface list | grep port2
if=port2 family=00 type=1 index=10 mtu=1500 link=0 master=0
FortiTester 测试
hash-mode 设置为 inbandwidth,因为 iperf 打流是 download,cps = 1000,get 30kb。
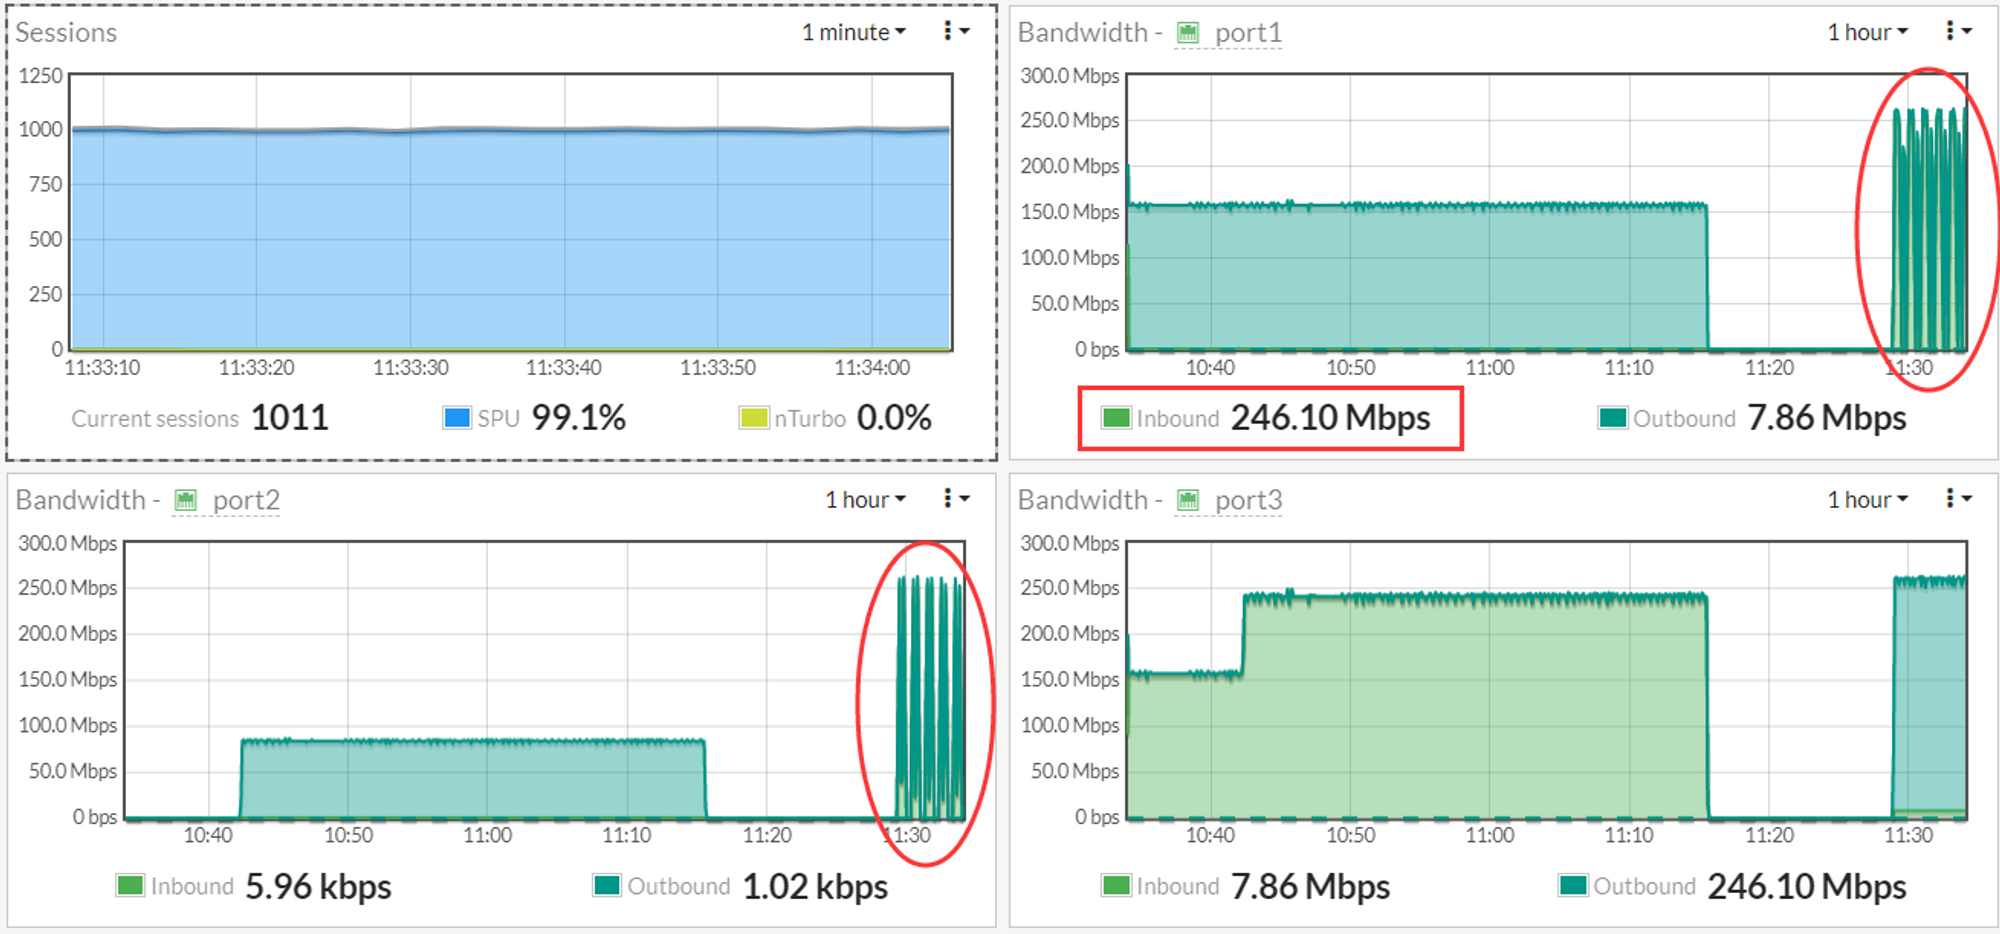
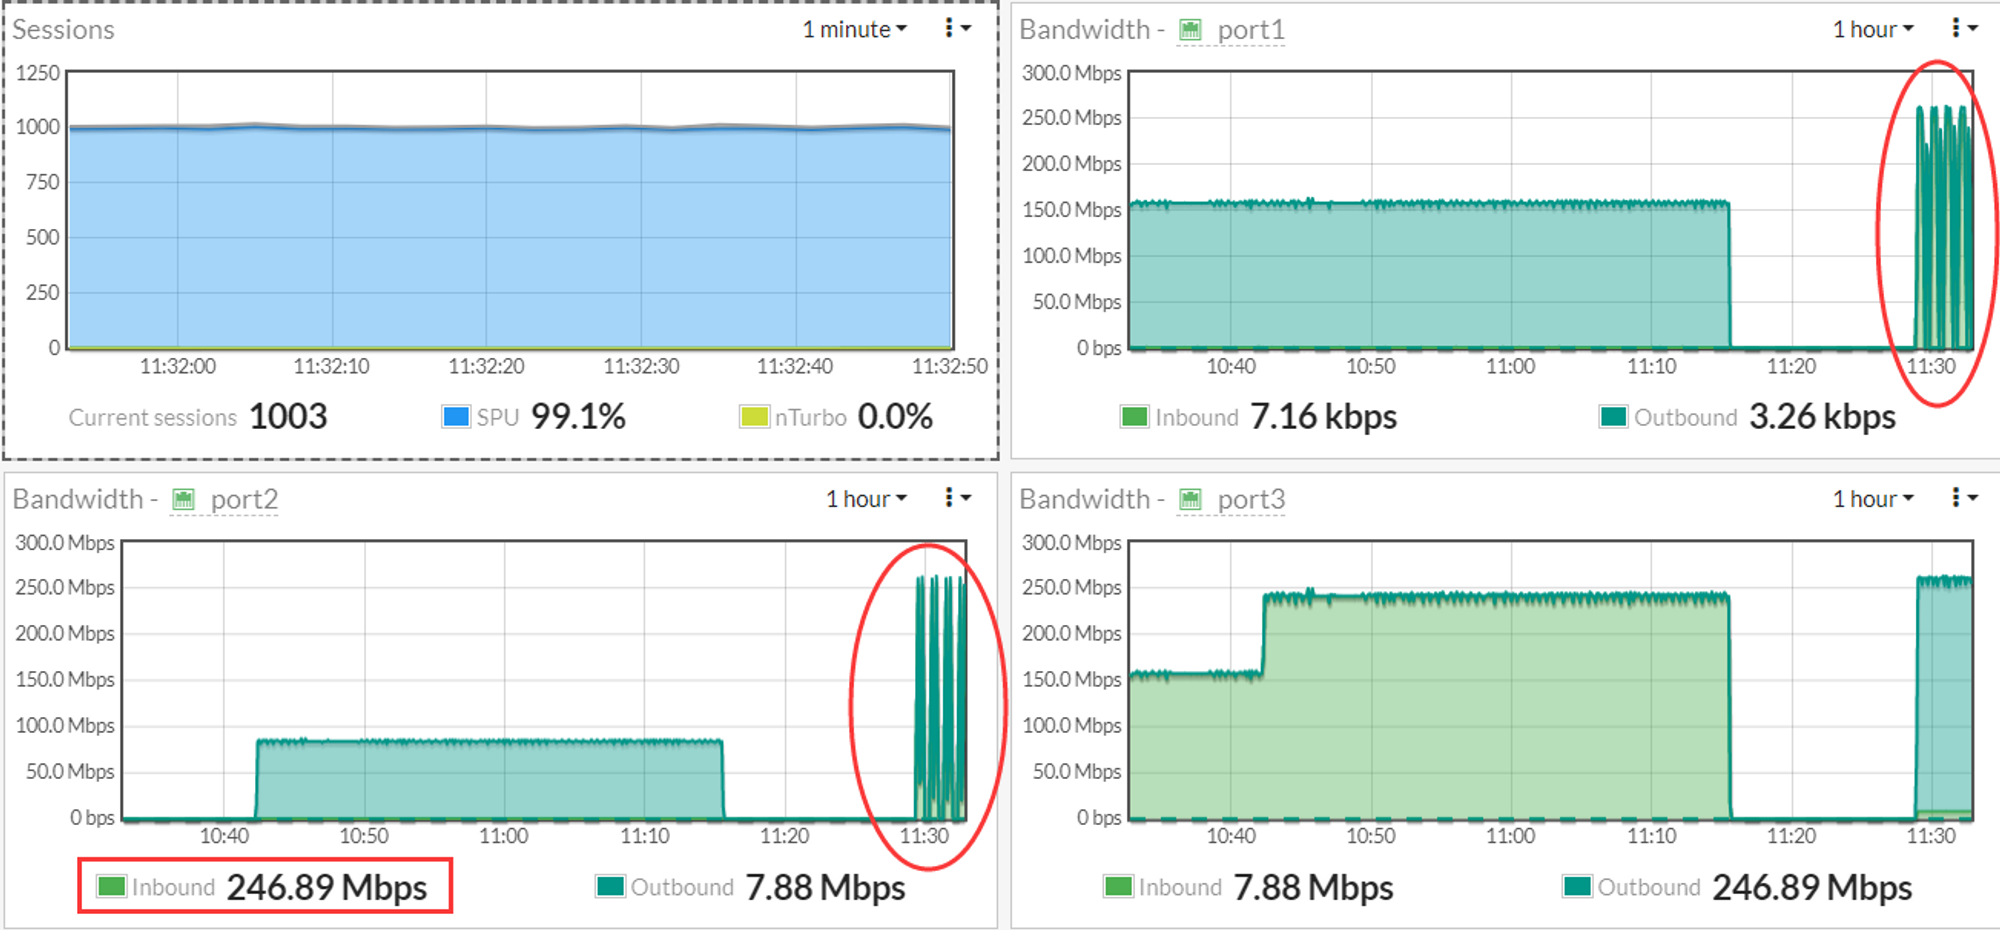
# diagnose sys sdwan service

Service(1): Address Mode(IPV4) flags=0x200
  Gen(1), TOS(0x0/0x0), Protocol(0: 1->65535), Mode(load-balance hash-mode=inbandwidth)
  Members(2):
    1: Seq_num(1 port1), alive, sla(0x1), gid(2), num of pass(1), inbandwidth: 199991Kbps, selected //port1优先//
    2: Seq_num(2 port2), alive, sla(0x1), gid(2), num of pass(1), inbandwidth: 99993Kbps, selected
  Src address(1):
        10.0.0.0-10.255.255.255
  Dst address(1):
        0.0.0.0-255.255.255.255
从接口流量图看,流量一会从 port1 走,一会从 port2,没有负载到两条链路,是由于 FortiTester 打流新建会话和拆除会话太快,SDWAN 带宽监控反应不过来。
对应的 SD-WAN 服务状态。
# diagnose sys sdwan service
Service(1): Address Mode(IPV4) flags=0x200
  Gen(13), TOS(0x0/0x0), Protocol(0: 1->65535), Mode(load-balance hash-mode=inbandwidth)
  Members(2):
    1: Seq_num(1 port1), alive, sla(0x1), gid(2), num of pass(1), inbandwidth: 48600Kbps, selected
    2: Seq_num(2 port2), alive, sla(0x1), gid(2), num of pass(1), inbandwidth: 0Kbps, selected
  Src address(1):
        10.0.0.0-10.255.255.255
  Dst address(1):
        0.0.0.0-255.255.255.255

# diagnose sys sdwan service
Service(1): Address Mode(IPV4) flags=0x200
  Gen(14), TOS(0x0/0x0), Protocol(0: 1->65535), Mode(load-balance hash-mode=inbandwidth)
  Members(2):
    1: Seq_num(2 port2), alive, sla(0x1), gid(2), num of pass(1), inbandwidth: 48225Kbps, selected
    2: Seq_num(1 port1), alive, sla(0x1), gid(2), num of pass(1), inbandwidth: 554Kbps, selected
  Src address(1):
        10.0.0.0-10.255.255.255
  Dst address(1):
        0.0.0.0-255.255.255.255
真实流量测试
使用迅雷下载一部电影,速度平均 5.2MB/s 左右,查看接口带宽分配的实际效果。
公网实际带宽不大,因此将预估带宽调小,hash-mode 使用 inbandwidth。
config system interface
    edit "port1"
        set ip 202.101.1.1 255.255.255.0
        set estimated-upstream-bandwidth 40000
        set estimated-downstream-bandwidth 40000
    next
    edit "port2"
        set vdom "root"
        set estimated-upstream-bandwidth 20000
        set estimated-downstream-bandwidth 20000
    next
end
对应的 SD-WAN 服务状态。
# diagnose sys sdwan service
Service(1): Address Mode(IPV4) flags=0x200
  Gen(7), TOS(0x0/0x0), Protocol(0: 1->65535), Mode(load-balance hash-mode=inbandwidth)
  Members(2):
    1: Seq_num(1 port1), alive, sla(0x1), gid(2), num of pass(1), inbandwidth: 39936Kbps, selected
    2: Seq_num(2 port2), alive, sla(0x1), gid(2), num of pass(1), inbandwidth: 19993Kbps, selected
  Src address(1):
        10.0.0.0-10.255.255.255
  Dst address(1):
        0.0.0.0-255.255.255.255
对应带宽图。

总结
- 基于带宽的 Maximize Bandwidth 适用于流量缓慢增长,多会话的场景。
- 下面两种情况不适用:
- 只有一条会话,且带宽很大,是不会切换的。
- 突发流量,短时间流量很大,SD-WAN 无法及时感知。